LoL: G2 vs. PSG - The problem with ego-drafting
How ego-drafting can seriously impact a team’s win chance in stage games of League of Legends (LoL). An analysis of the G2 Esports loss against PSG Talon at MSI.
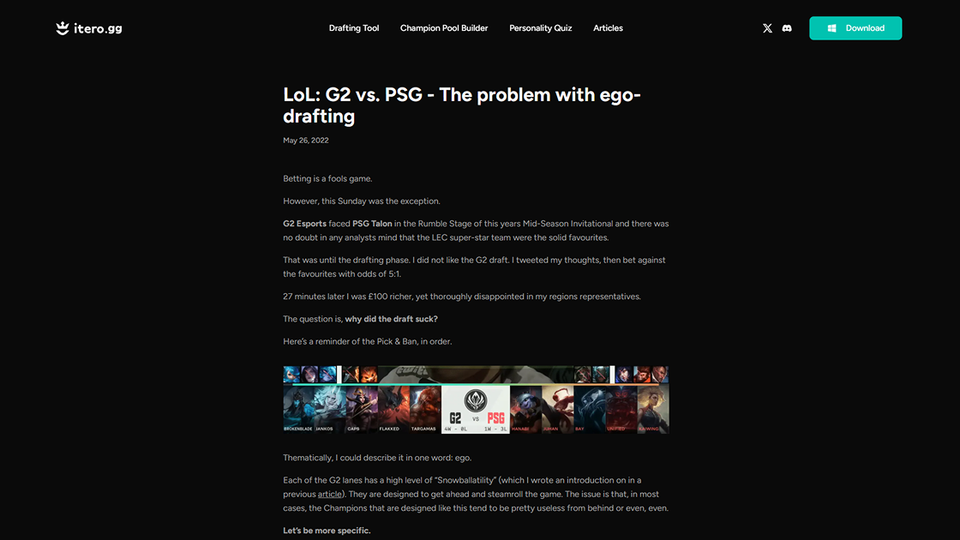

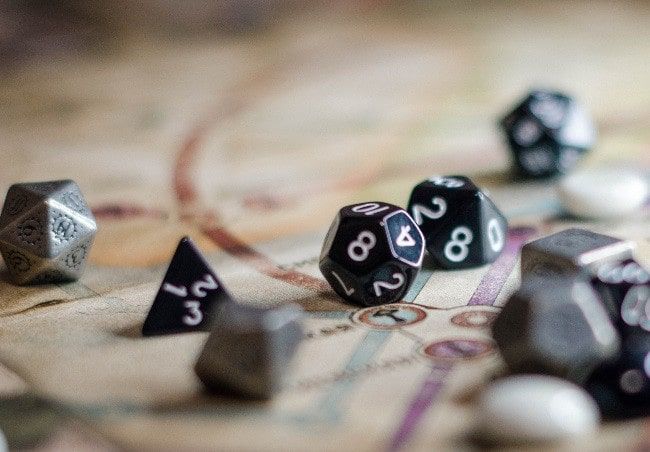
Image by Nika Benedictova. Source: Unsplash
How much of a game is driven by luck? Who controls the fates, the player or the roll of the dice?
Take two traditional games, chess and poker. In the former, each decision is your own and without question the one who played the best shall win the game. In contrast, for poker the luck of the draw can have disastrous consequences even when played to perfection.
In gaming, this is commonly referred to as the impact of a Random Number Generator, or RNG for short (which is most apt for the context of this article!). It is the system which determines whether you hit that 20% critical strike to turn the tides of the team fight.
In esports and particularly in League of Legends, we like to believe we’re more equivalent to a deterministic game (like chess) than a probabilistic one (like poker). May the better team on the day win every game.
However, this was all called into question after T1 lost to RNG in the 2022 MSI Finals in a seemingly close fought best-of-five. The controversy came in a post-match interview with Polt, the Head Coach for T1:
“The reason we lost was, as I just said, because we weren’t able to play on the blue side three times” - Polt, T1 Head Coach (Source: InvenGlobal )
For those who aren’t aware, in a best-of-five series the loser of each match gets to choose the side for the next one. The question is, who gets to pick the first match?
They flip a coin.
Now, as a statistician I’m far less interested in questioning this format and instead I want to answer: How Much Does Side Selection Matter, Really?
Before we get into the results, we must first understand what it means to play each side of the map. What fundamentally makes them more or less appealing to play on?
Anyone who’s followed my content for a while will know I specialise in the prediction and optimisation of drafts. I am a strong believer that games can be heavily swung for either side at this early stage of the game (for example, see my previous article on why I bet against G2 the second they locked in their Champions against PSG). How much then, does side selection impact the draft?
A primary advantage of Blue Side is that you are the first to pick a Champion. That means, if there’s anything that’s considered “giga broken” then Red Side is “forced” to ban it.
For instance, in this years MSI Lucian was banned in 74 of the 77 games. For 63 of these games, it was Red Side who made the ban. In the 3 games it wasn’t banned, that team won.
For those who have been around a bit longer may remember the S9 World Championships, where Pantheon was banned in 119 of the 120 games. An incredible 116 of these by Red Side!
This, in essence, gives Red Side one less opportunity to make a strategically placed ban.
However, it’s not all downside. For instance, as they will be the last pick in the draft they can choose which lane they wish to counter. This is particularly useful if they wanted to negate the impact of an opposing star player by guaranteeing the favourable match-up, or likewise to enable their best.
Red Side also get the first choice after the second round bans, which means they can remove key counter picks to a strong Champion and guarantee they either get it, or force the ban.
Statistically, it’s very, very difficult to conclude whether one side or the other gets the advantage during draft (I’ve spent a long time trying!) and would be a whole article, or thesis, on it’s own.
Summoner Rifts is, compared to most games, fairly balanced. However, without a doubt there are strategic advantages to being on either side of the map.
Vulnerability
Take the vulnerability of the bottom lane for instance. A Red Side Jungler has a distinct advantage here since they can attack further behind the central line whilst remaining outside the turrets range.
Summoner’s Rift, by Riot Games & Edited by Author
But how does this actually translate to deaths? Let’s look at which lanes are most likely to be the victim of first blood:
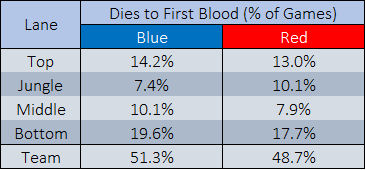
Lane First Death Percentage. Table by Author.
Our initial theory is correct, the Blue Side bottom lane is the victim of first blood in 19.6% of the games, compared to 17.7% for the Red Side.
However, since this layout is mirrored on the top side we would expect the inverse relationship where Red Side dies more. Instead, again Blue is more vulnerable here(14.2% to 13.0%).
My theory is that the tri-brush provides easier access for the Jungler to turret dive, which is a more common death for Top laners than Bottom laners — although I don’t have the data to justify it so we’ll return to that another day.
As to why Junglers die so much more on Red Side, your guess is as good as mine!
Objective Control
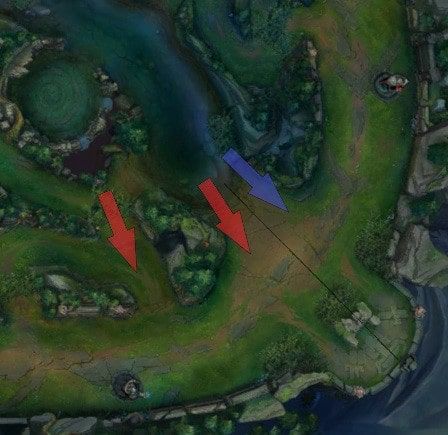
The second part is the strategic access teams have to the key objectives. Any military tactician (or Jedi) worth their salt knows to avoid two things: low ground and choke points. The reason for the latter is that you want to avoid allowing the opposition to effectively concentrate fire and resources in one place.
From a League standpoint, you can see from the below that there’s a distinct ground advantage for Blue Side at the Baron pit. They have both access to more, and wider corridors to attack the position. Then, it can be defended from a limited number of tight choke points. Likewise, Red Side have this same advantage on the Dragon pit.
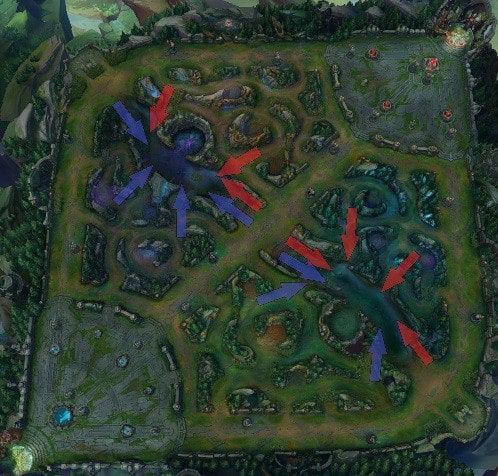
Summoner’s Rift, by Riot Games & Edited by Author
As we can see from the following table, this strategic ground advantage directly equates to early game objective statistics. Blue Side takes more Heralds, Red Side takes more Dragons.
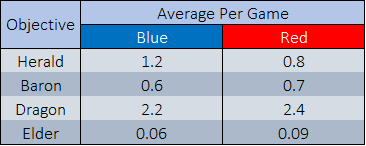
Average Number of Objectives for Each Side. Table by Author.
This relationship becomes less distinct as the game progresses with Red Side having a slight advantage on end-game objectives such as Barons and Elders.
So, how much does side selection really matter!
Let us first answer the question directly.
Over the almost 5,000 matches played since 2020 in the major leagues (LCK, LPL, LEC, LCS, MSI or Worlds) the Blue Side won in 51.9% of them.
That may be simple, but it far from confirms Polts point. First and foremost, it isn’t exactly what I’d call insurmountable odds.
Secondly, is that this is far too generic to match the case in question. For instance, in the LEC and LCS the regular season games are played in best-of-1s where there is no opportunity to adapt the draft. On the other hand, LEC/LCS Playoffs, LCK/LPL and international knock-out stages use a best-of-three or five format.
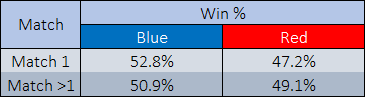
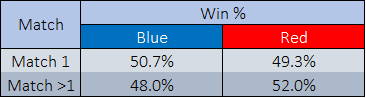
So, let’s look at the difference between side win rates depending on whether it’s the first match (either in a series, or just a best-of-one), or any match after the first (>1):
Average Win Rate For Match 1s vs. non-Match 1s by Side. Table by Author.
For Match 1s, Blue Side wins 52.8% of the games. After that opening match, the result gets ever closer to even at 50.9%. Statistically speaking, this is still “significant” in the sense that you can say with confidence that the sides aren’t equal, but barely.
I even took this a step further and looked at JUST game 5 results. For this, Red Side actually won 62.5% of the matches! The reason this isn’t the headline and central argument of the entire article is because the sample size (around 50) is far too small for us to derive significance.
We can also never escape the fact that League is a constantly evolving game, what is true today in all likelihood will not be next year, and so on. So how has the side selection changed over time?
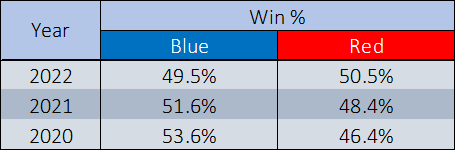
Average Win Rate by Year and Side. Table by Author.
Once again, the value of Blue Side has eroded even further with time. My primary theory here is that the relative value of dragons has improved in this same timeframe, adding more value to the Red Side map control of the pit. That’s another one for another time, however.
So, finally — let us limit the Match 1 vs. not-Match 1 table to 2022 games. Note, and please do note with extra vigilance: there have only been 444 of the “not-Match 1”s this year.
Average Win Rate for Match 1s vs. non-Match 1s per Side in 2022. Table by Author.
From this, best-of-N series are actually in favour of the Red Side from the more recent data at 52.0%.
Note: there are some other effects coming into play here. Not all best-of-Ns are alike. A best-of-three in the LCK regular season isn’t equivalent to a best-of-five for the World Finals and so on. We could keep breaking apart and rearranging these numbers to our hearts content and each time we’d see a slightly varied result.
The truth of the matter is that I could have easily been more deliberate in my analysis and have built a solid argument for either side of this debate, or none at all. The sample sizes are too small, the game too volatile and the “but have you considered” too broad.
I conclude not with statistics but instead, a principle.
Each game we play is a mixed bag of practiced skill and sheer luck. Climbing the Solo Queue ladder each day you are in control of but one thing alone: you. To fixate on what misfortune it is to be once again blind picking or how you always get the short straws for team mates distracts from what really matters: what you can do better.
Likewise, any professional team should spend no time at all concerning themselves about whether they have that +-1% chance due to the turning of a coin, and instead on how they.
Here are some other articles that may be of interest.
How ego-drafting can seriously impact a team’s win chance in stage games of League of Legends (LoL). An analysis of the G2 Esports loss against PSG Talon at MSI.
An explanation of the statistic “snowballatility” and why it matters in League of Legends (Lol) drafting for stage games in esports. Some Champion’s are better than others with a Gold lead!
A statistical analysis of Top Laners for the League of Legend’s esports league: the LEC, and who you should draft if you had a choice!